VIII. Creating Output Files for Xgraph
[Previous section]
[Next Section]
[Back to the index]
One part of the ns-allinone package is 'xgraph', a plotting program which
can be used to create graphic representations of simulation results. In this
section, I will show you a simple way how you can create output files in
your Tcl scripts which can be used as data sets for xgraph. On the way
there, I will also show you how to use traffic generators.
A note: The technique I present here is one of many possible ways to create
output files suitable for xgraph. If you think there is a technique which is
superior in terms of understandablity (which is what I aim for in this
tutorial), please let me know.
VIII.1. Topology and Traffic Sources
First of all, we create the following topology:

The following piece of code should look familiar to you by now if you read
the first sections of this tutorial.
set n0 [$ns node]
set n1 [$ns node]
set n2 [$ns node]
set n3 [$ns node]
set n4 [$ns node]

$ns duplex-link $n0 $n3 1Mb 100ms DropTail
$ns duplex-link $n1 $n3 1Mb 100ms DropTail
$ns duplex-link $n2 $n3 1Mb 100ms DropTail
$ns duplex-link $n3 $n4 1Mb 100ms DropTail
|
We are going to attach traffic sources to the nodes n0, n1 and n2, but first
we write a procedure that will make it easier for us to add the traffic
sources and generators to the nodes:
proc attach-expoo-traffic { node sink size burst idle rate } {
	#Get an instance of the simulator
	set ns [Simulator instance]

	#Create a UDP agent and attach it to the node
	set source [new Agent/UDP]
	$ns attach-agent $node $source

	#Create an Expoo traffic agent and set its configuration parameters
	set traffic [new Application/Traffic/Exponential]
	$traffic set packetSize_ $size
	$traffic set burst_time_ $burst
	$traffic set idle_time_ $idle
	$traffic set rate_ $rate

        # Attach traffic source to the traffic generator
        $traffic attach-agent $source
	#Connect the source and the sink
	$ns connect $source $sink
	return $traffic
}
|
This procedure looks more complicated than it really is. It takes six
arguments: A node, a previously created traffic sink, the packet size for
the traffic source, the burst and idle times (for the exponential
distribution) and the peak rate. For details about the Expoo traffic
sources, please refer to the documentation
for ns.
First, the procedure creates a traffic source and attaches it to the node,
then it creates a Traffic/Expoo object, sets its configuration parameters
and attaches it to the traffic source, before eventually the source and
the sink are connected. Finally, the procedure returns a handle for the
traffic source. This procedure is a good example how reoccuring tasks
like attaching a traffic source to several nodes can be handled. Now we use
the procedure to attach traffic sources with different peak rates to n0, n1
and n2 and to connect them to three traffic sinks on n4 which have to be
created first:
set sink0 [new Agent/LossMonitor]
set sink1 [new Agent/LossMonitor]
set sink2 [new Agent/LossMonitor]
$ns attach-agent $n4 $sink0
$ns attach-agent $n4 $sink1
$ns attach-agent $n4 $sink2

set source0 [attach-expoo-traffic $n0 $sink0 200 2s 1s 100k]
set source1 [attach-expoo-traffic $n1 $sink1 200 2s 1s 200k]
set source2 [attach-expoo-traffic $n2 $sink2 200 2s 1s 300k]
|
In this example we use Agent/LossMonitor objects as traffic sinks, since they
store the amount of bytes received, which can be used to calculate the
bandwidth.
VIII.2. Recording Data in Output Files
Now we have to open three output files. The following lines have to appear
'early' in the Tcl script.
set f0 [open out0.tr w]
set f1 [open out1.tr w]
set f2 [open out2.tr w]
|
These files have to be closed at some point. We use a modified 'finish'
procedure to do that.
proc finish {} {
        global f0 f1 f2
        #Close the output files
        close $f0
        close $f1
        close $f2
        #Call xgraph to display the results
        exec xgraph out0.tr out1.tr out2.tr -geometry 800x400 &
        exit 0
}
|
It not only closes the output files, but also calls xgraph to display the
results. You may want to adapt the window size (800x400) to your screen
size.
Now we can write the procedure which actually writes the data to the output
files.
proc record {} {
        global sink0 sink1 sink2 f0 f1 f2
        #Get an instance of the simulator
        set ns [Simulator instance]
        #Set the time after which the procedure should be called again
        set time 0.5
        #How many bytes have been received by the traffic sinks?
        set bw0 [$sink0 set bytes_]
        set bw1 [$sink1 set bytes_]
        set bw2 [$sink2 set bytes_]
        #Get the current time
        set now [$ns now]
        #Calculate the bandwidth (in MBit/s) and write it to the files
        puts $f0 "$now [expr $bw0/$time*8/1000000]"
        puts $f1 "$now [expr $bw1/$time*8/1000000]"
        puts $f2 "$now [expr $bw2/$time*8/1000000]"
        #Reset the bytes_ values on the traffic sinks
        $sink0 set bytes_ 0
        $sink1 set bytes_ 0
        $sink2 set bytes_ 0
        #Re-schedule the procedure
        $ns at [expr $now+$time] "record"
}
|
This procedure reads the number of bytes received from the three traffic
sinks. Then it calculates the bandwidth (in MBit/s) and writes it to the
three output files together with the current time before it resets the
bytes_ values on the traffic sinks. Then it re-schedules itself.
VIII.3. Running the Simulation
We can now schedule the following events:
$ns at 0.0 "record"
$ns at 10.0 "$source0 start"
$ns at 10.0 "$source1 start"
$ns at 10.0 "$source2 start"
$ns at 50.0 "$source0 stop"
$ns at 50.0 "$source1 stop"
$ns at 50.0 "$source2 stop"
$ns at 60.0 "finish"

$ns run
|
First, the 'record' procedure is called, and afterwards it will re-schedule
itself periodically every 0.5 seconds. Then the three traffic sources are
started at 10 seconds and stopped at 50 seconds. At 60 seconds, the 'finish'
procedure is called. You can find the full example script
here.
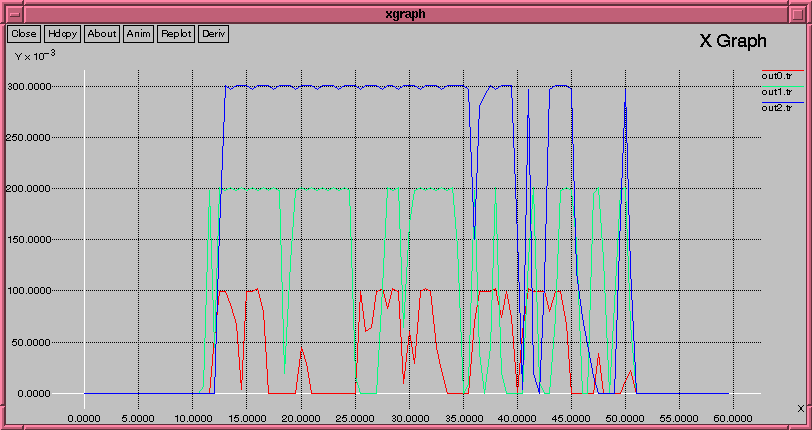
When you run the simulation, an xgraph window should open after some time
which should look similar to this one:

As you can see, the bursts of the first flow peak at 0.1Mbit/s, the second
at 0.2Mbit/s and the third at 0.3Mbit/s. Now you can try to modify the 'time'
value in the 'record' procedure. Set it to '0.1' and see what happens, and then
try '1.0'. It is very important to find a good 'time' value for each simulation
scenario.
Note that the output files created by the 'record' procedure can also be used
with gnuplot.
[Previous section]
[Next section]
[Back to the index]
ns-users
[email protected]


